The initial value of r
(r =0.235) resulted in LV =
1.015.
Try other values close to the initial value of r.
r = 0.2378 gives
exactly LV = 1.
Equation of Lotka :  must =
1
must =
1
This r is obtained on
an assumption that the generation is developing in a descrete way. However, it
can be used as an initial value for iteration to
get a more accurate value of r by using Lotka's equation.
From these data, r
(the intantaneous/continuous
rate of increase) is approximated:
Tc is the Average Generation Time (sometimes symbol
G is used)
px = probability of an individual to live into the next
age-class, is used in Leslie transition matrix, to predict the dynamics of the
population.
Proportion of
mortality, qx
Since no remaining individuals in age-class 10,
except in several cases for facilitation of the
computation, data in x10 is included in the table.
A Mathcad program - primer for
Lifetable analysis
Correction
to the text: Dinamika Populasi by
Rudy C Tarumingkeng
pp.
59-63 (In Indonesian), 1994.
This
program was originally prepared by the author in 1993 using earlier version of
MathcadR (Ver.
4?), but it should work with any version of Mathcad R.
Five hundred mosquito larvae were
collected and reared in laboratory. The cohort were observed every two days for
any surviving individuals. The age-class (x
) is two days. ax denotes the s
urviving individuals in each class. The
surviving individuals are depicted in vector a
below.
At x=10 the original individuals
were all dead (a 10 =0). During the rearing period the number of surviving
eggs were laid: at x=6, 1600; at x=7, 360; at x=8, 300; and at x=9, 25.
The data are hypothetic. It was
assumed that all individuals in the cohort and their offspring were females. The
idea is to show how to compute the essential statistics in lifetable analysis.
LIFE
TABLE --- PROGRAM MATHCAD
< dapat dikutip
dengan menyebut sumber>
Ro denotes the Nett Reproduction Rate,
which is the (probability)
averave number of female
offspring produced by one female
at age-class 0.
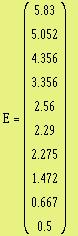
Note: Capital E is
used here instead of lower the
case (e) since e is a constant for natural log
base,
built in Mathcad.
Ex is the expected
longevity of the
individuals in each age-class
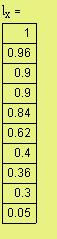
Proportion of the total remaining individuals in the cohort
from age class 0 through the age-class x,

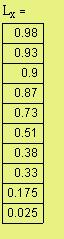
Average proportion
of lx and lx+1 (L
x)